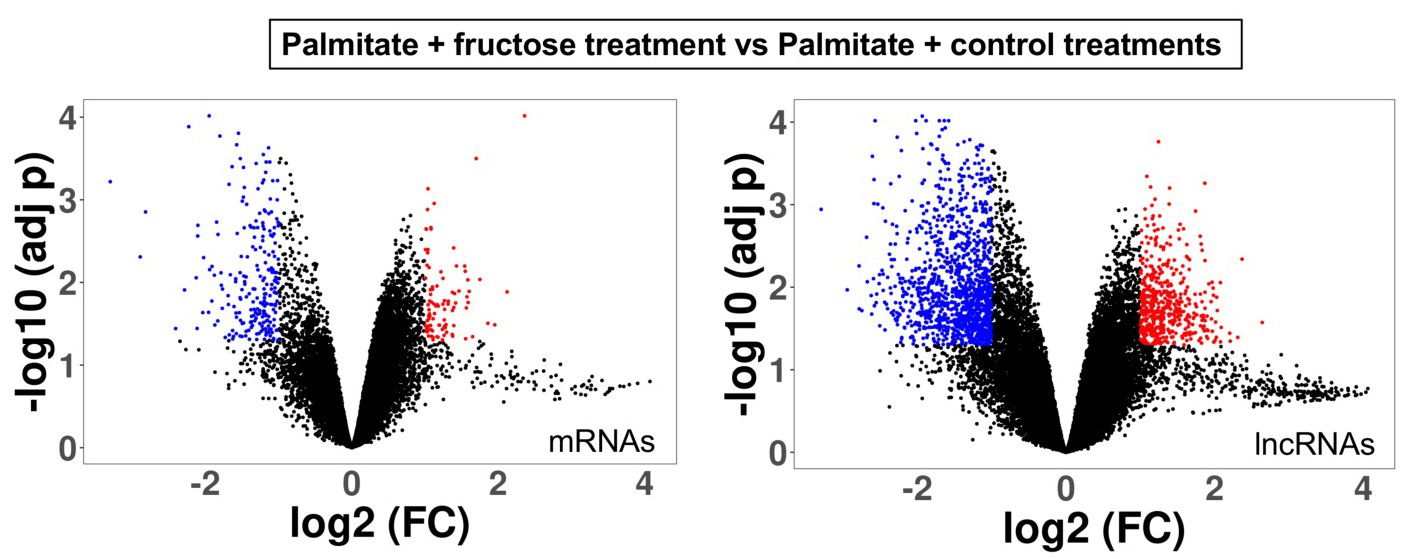
Fig. 3. Differentially expressed transcripts in HSCs exposed to conditioned media from PF-treated hepatocytes compared to P + CT hepatocytes. Volcano plot for HSCs exposed to conditioned media from hepatocytes treated with 1 mM palmitate and 10 mM fructose versus the combined gene sets from palmitate-only and control-treated cells was performed to identify differentially expressed mRNAs and lncRNAs between groups. In the x-axis the is reported the log2 fold change, in the y-axis the -log10(adj p) . Data points in red represent significantly upregulated transcripts, while those in green represent significantly downregulated transcripts (log2 fold change ³ |1|; adj p<0.05). Black-colored data points represent RNAs not showing statistically significant evidence for differential expression between treatment groups.